Visibility Graph Navigation
Goal
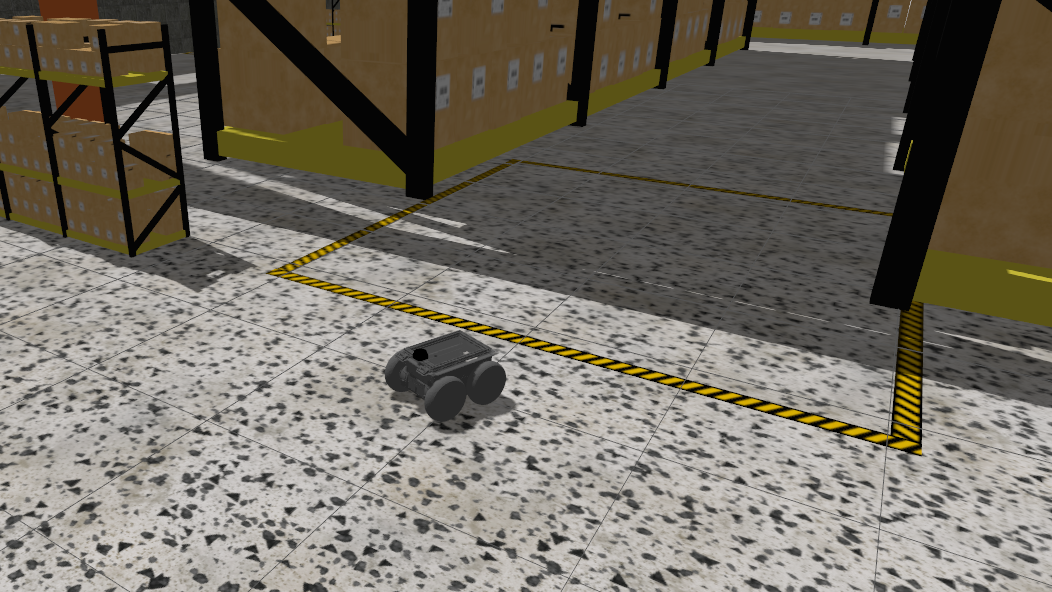
The goal of this exercise is to implement a Visibility Graph path planning algorithm that allows a robot to navigate autonomously through a warehouse environment from its current position to a target destination.
The robot must be able to:
- Load and process a 2D occupancy map of the environment
- Build a visibility graph connecting obstacle vertices that have line-of-sight to each other
- Find the shortest collision-free path from start to goal using Dijkstra’s algorithm
- Follow the computed path by navigating through each waypoint in sequence
Frequency API
Python
import Frequency- to import the Frequency library class. This class contains the tick function to regulate the execution rate.Frequency.tick(ideal_rate)- regulates the execution rate to the number of Hz specified. Defaults to 50 Hz.
C++
#include "Frequency.hpp"- to import the Frequency library class. This class contains the tick function to regulate the execution rate.Frequency freq = Frequency();- to instanciate the Frequency class.freq.tick(ideal_rate);- regulates the execution rate to the number of Hz specified. Defaults to 50 Hz.
Robot API
This exercise now supports ROS 2-direct implementation in addition to the original HAL-based approach. Below you’ll find the details for both options.
HAL-based Implementation
Python
import HAL- to import the HAL library class. This class contains the functions that receive information from the sensors or work with the actuators.import WebGUI- to import the WebGUI (Web Graphical User Interface) library class. This class contains the functions used to interact with the map visualization and coordinate conversions.HAL.getPose3d().x- to get the ground-truth X position of the robot in world coordinates.HAL.getPose3d().y- to get the ground-truth Y position of the robot in world coordinates.HAL.getPose3d().yaw- to get the ground-truth orientation of the robot in radians.HAL.setV(v)- to set the linear velocity of the robot (m/s).HAL.setW(w)- to set the angular velocity of the robot (rad/s).WebGUI.getMap()- returns the warehouse map as a NumPy array (RGB, 603×1002 pixels).WebGUI.showNumpy(image)- displays a NumPy image array on the map canvas. Accepts RGB or grayscale arrays; resizes automatically to 603×1002 if needed.WebGUI.worldToMap(x, y)- converts world coordinates (meters) to map pixel coordinates(col, row).WebGUI.mapToWorld(col, row)- converts map pixel coordinates(col, row)to world coordinates(x, y)in meters.WebGUI.line(color, p1, p2)- draws a line on the map overlay between two world-coordinate points.coloris an RGB tuple, e.g.(0, 255, 0).p1andp2are world-coordinate tuples(x, y).WebGUI.clearLines()- clears all lines previously drawn on the map overlay.
C++
#include "HAL.hpp"- to import the HAL (Hardware Abstraction Layer) library class. This class contains the functions that send and receive information to and from the Hardware (Gazebo).#include "WebGUI.hpp"- to import the WebGUI (Web Graphical User Interface) library class. This class contains the functions used to interact with the map visualization and coordinate conversions.HAL::set_v(velocity);- sets the linear velocity of the robot. The input is afloat. Returnsvoid.HAL::set_w(velocity);- sets the angular velocity of the robot. The input is afloat. Returnsvoid.HAL::get_pose3d();- returns the ground-truth robot pose as aHAL::Pose3d.HAL::get_pose3d().x;- gets the robot x position in world coordinates (double).HAL::get_pose3d().y;- gets the robot y position in world coordinates (double).HAL::get_pose3d().yaw;- gets the robot orientation around the vertical axis in world coordinates (double).WebGUI::get_map(url);- loads the warehouse map from disk and returns it as a colourcv::Mat.urlis the map path,/resources/exercises/visibility_graph/images/warehouse.png.WebGUI::show_numpy(image);- displays acv::Maton the map canvas. Accepts colour or grayscale images; resizes automatically to 603×1002 if needed.WebGUI::world_to_map(x, y);- converts world coordinates (metres) to map pixel coordinates. Returns astd::vector<int>{col, row}.WebGUI::map_to_world(col, row);- converts map pixel coordinates to world coordinates (metres). Returns astd::vector<double>{x, y}.WebGUI::line(color, p1, p2);- draws a line on the map overlay between two world-coordinate points.coloris astd::vector<int>{r, g, b},p1andp2arestd::vector<double>{x, y}.WebGUI::clear_lines();- clears all lines previously drawn on the map overlay.
In order to use the HAL-based controls you must include the following lines:
#include "HAL.hpp"
#include "WebGUI.hpp"
#include "Frequency.hpp"

void exercise() {
    Frequency freq = Frequency();
    // Enter sequential code!

    while (true)
    {
        // Enter iterative code!
        freq.tick();


    }
}
ROS 2-direct Implementation
Use standard ROS 2 topics for direct communication with the simulation.
-
/cmd_vel- Publish to this topic to set both linear and angular velocities. Message type:geometry_msgs/msg/Twist -
/odom- Subscribe to this topic to receive the robot odometry, from which the pose (x,y,yaw) can be extracted. Message type:nav_msgs/msg/Odometry
For map debugging, the /webgui/* topics mirror the WebGUI drawing methods one to one:
-
/webgui/debug_image- Publish to this topic to display an image on the map canvas, equivalent toshowNumpy. Message type:sensor_msgs/msg/Image, encodingbgr8. -
/webgui/lines- Publish to this topic to draw lines on the map overlay, equivalent toline. Message type:std_msgs/msg/String, containing a JSON array of entries{"color": [r, g, b], "p1": [x, y], "p2": [x, y]}in world coordinates. -
/webgui/clear_lines- Publish to this topic to clear all lines previously drawn on the map overlay, equivalent toclearLines. Message type:std_msgs/msg/Empty.
All /webgui/* topics use the default QoS profile with a history depth of 10.
Loading the map image itself is not exposed as a topic, so a ROS 2-direct solution should read /resources/exercises/visibility_graph/images/warehouse.png directly from disk and apply the same world-to-map transform used by WebGUI, resolution 0.05 m/px, origin (-15.0, -25.0), size 1002x603 px.
Python
Note: Ensure this import is included in your script to access the Web GUI functionalities.
import WebGUI - to enable the Web GUI for visualizing debug information.
To have frequency control you need to use standard ROS 2 mechanisms to manage loop timing:
rclpy.spin()- Event-driven execution using callbacks.rclpy.spin_once()- Single-step processing, often with custom timers.rclpy.Rate()- Loop-based frequency control.
Note
WebGUI already initializes rclpy internally, so this should be taken into account when building a direct ROS 2 solution.
C++
In order to use direct ros controls you must include the following lines:
#ifndef USER_NODE
#define USER_NODE

#include "rclcpp/rclcpp.hpp"

class UserNode : public rclcpp::Node {
  // Your class
};

#endif
You must define USER_NODE and a UserNode node class.
To have frequency control you may use a timer and a control function as follows:
  UserNode() : Node("user_node")
  {
    // More subscribers and publishers
    timer_ = create_wall_timer(100ms, std::bind(&UserNode::control_cycle, this));
  };

// More Code

  void control_cycle(){
    // Your function
  };
Theory
Path Planning
Path planning is the problem of finding a collision-free route for a robot between a start position and a goal position in an environment with obstacles. Classical approaches represent the environment as a graph and apply graph-search algorithms to find the optimal path.
Visibility Graph
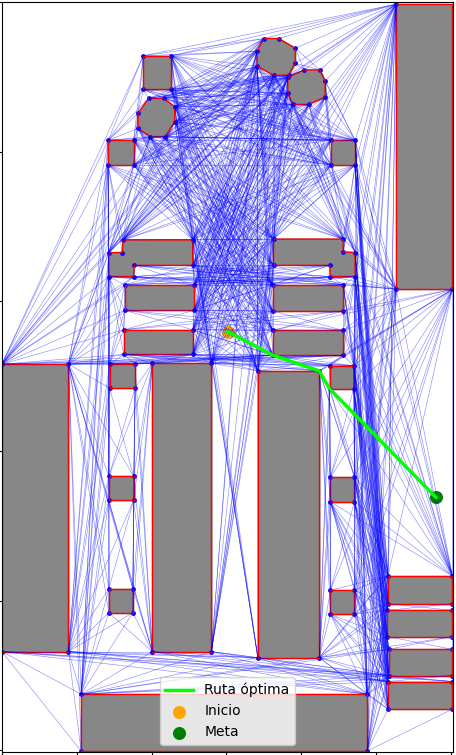
A visibility graph is a graph-based path planning structure built from the geometry of the obstacles in the environment. The key idea is that the shortest path between two points in a 2D environment with polygonal obstacles always passes through the vertices of those obstacles — never through a point on the interior of an obstacle boundary.
Construction:
- Obstacle extraction: The occupancy map is thresholded and the obstacle contours are extracted. To ensure safe navigation, the obstacles are inflated (dilated) by a margin before extracting their vertices.
- Vertex extraction: The corner points of each obstacle contour are collected as candidate graph nodes. The start and goal positions are also added as nodes.
- Edge generation: For every pair of nodes, a line-of-sight check is performed. If the straight segment between two nodes does not intersect any obstacle, an edge is added to the graph.
- Shortest path: Dijkstra’s algorithm is applied on the visibility graph to find the minimum-cost path from start to goal.
Line-of-sight check:
A segment between two nodes is considered free if no point along it falls inside an obstacle. This check is performed in pixel space over the dilated obstacle mask.
Dijkstra’s algorithm:
Dijkstra finds the shortest path in a weighted graph. Edge weights are Euclidean distances between nodes in pixel space. The algorithm maintains a priority queue and expands the lowest-cost node first, guaranteeing optimality.
Obstacle Inflation
Before extracting vertices, the obstacle mask is morphologically dilated using a square kernel. This creates a safety margin so that the robot’s body does not clip obstacle edges when following the planned path. The inflation radius should be chosen according to the robot’s physical size.
Videos
Contributors
- Contributors: Carlos Iglesias
- Maintained by Carlos Iglesias